Accuracy above threshold
100%
0 errors at ≥90% confidence
The case for deterministic vision
Vision-LLMs are probabilistic and billed per call: same photo, different answer, every time. Deterministic computer vision is repeatable, audit-friendly and runs on free open-source weights — zero per-call cost, predictable accuracy, full data control on your own infrastructure.
Accuracy above threshold
100%
0 errors at ≥90% confidence
Per-photo inference
~10s
Single-frame ML CV pipeline
Cost per 1 000 photos
€0
Self-hosted ML CV — no per-call API fees
Cloud vision API
€15+
Same volume via cloud vision LLM
Pipeline output
Each frame is graded by what's actually in it — cable (duct) and measurement reference (tape), both, one, or neither. The category tells the inspector whether the report stands on its own or needs a re-shoot.
Cable AND measurement reference visible — the report stands on its own.
Cable visible, measurement reference missing — partial context.
Measurement in frame, cable not visible — partial context.
Neither cable nor measurement — flag for re-shoot.
The process starts with the unmodified field image captured during inspection.
YOLO identifies relevant visible objects, pipe elements, and structural features in the photo.
Detected objects are grouped into meaningful categories based on the recognition results.
OCR reads embedded photo information to retrieve latitude and longitude when available.
The system scores recognition certainty so clients can understand the reliability of the output.
Final findings are assembled into a structured report for review, export, and follow-up decisions.
Detection in action
Boxes left, distribution right. Drag the slider to see how the confidence curve sharpens as the training pool grows.
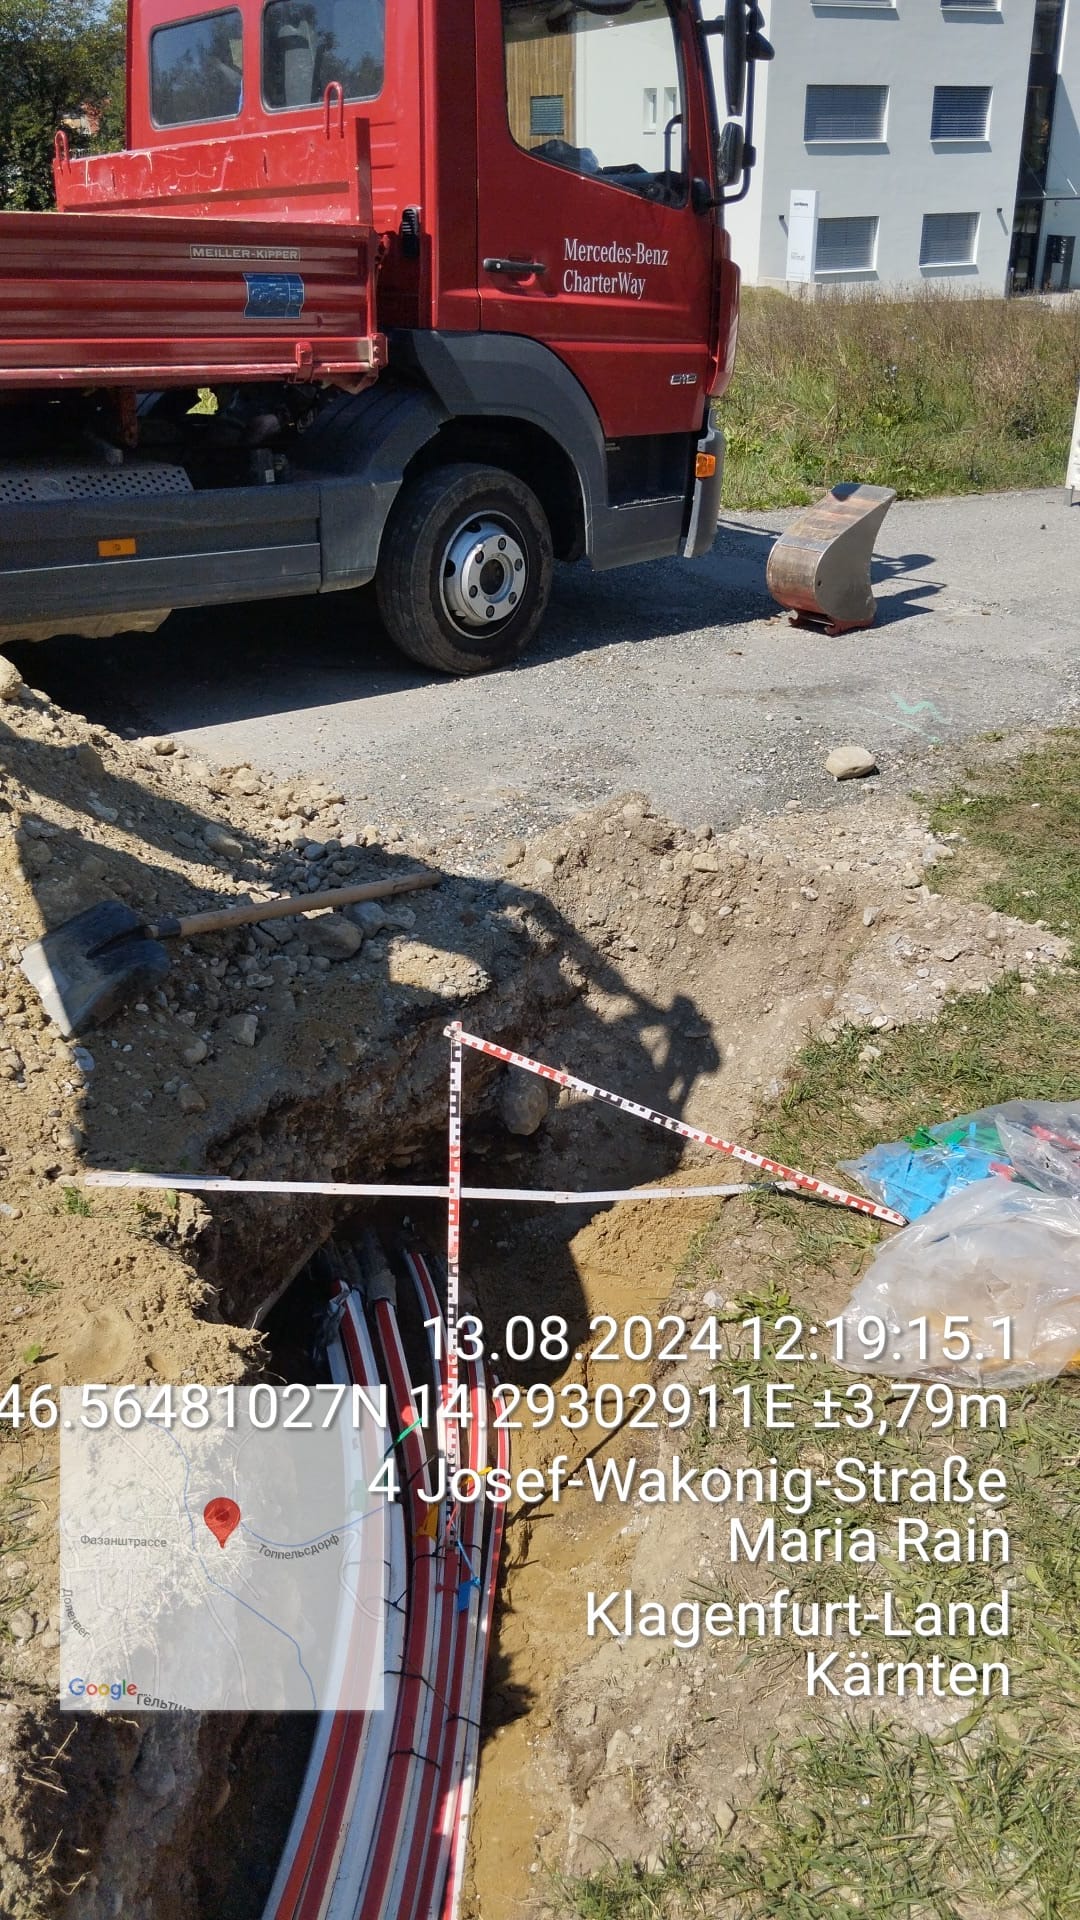
Original Photo
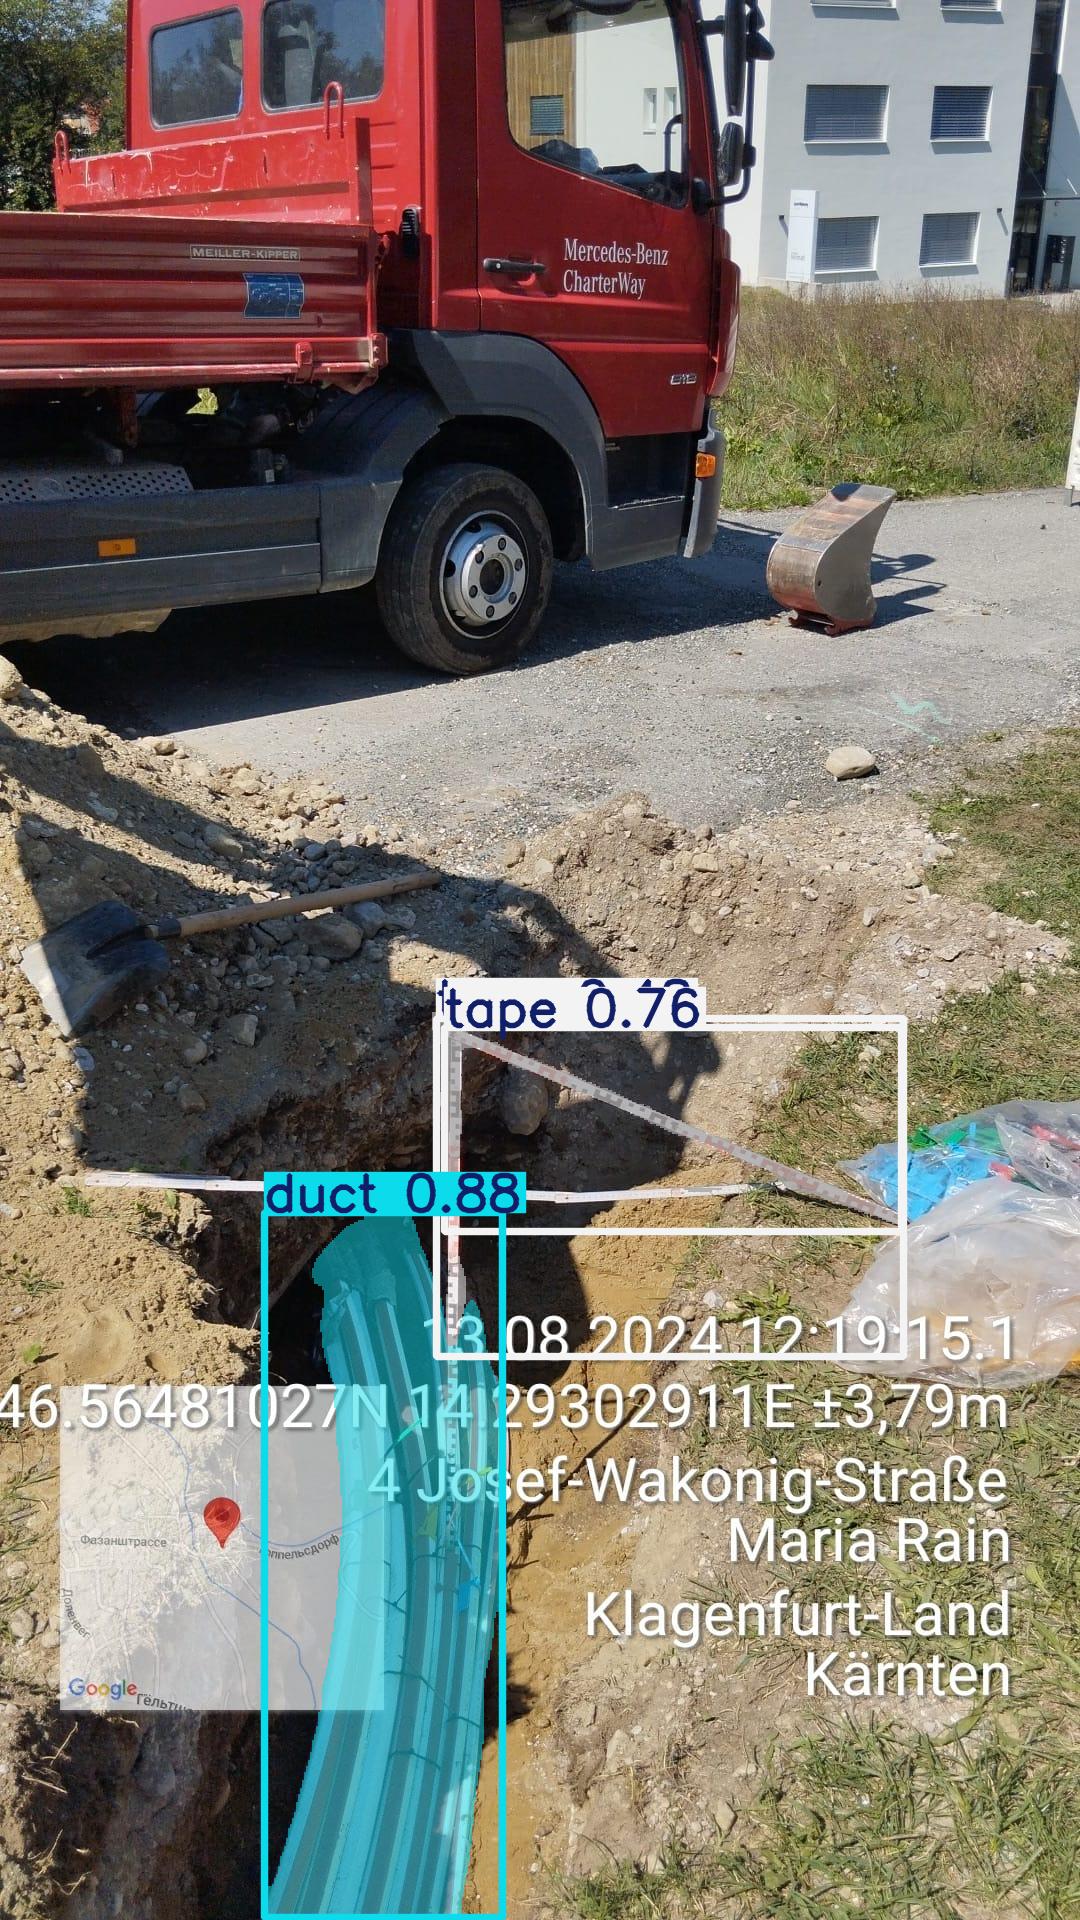
After YOLO Detection
Confidence histogram
Hands-on demo
Try it live — watch the walkthrough, then upload an inspection frame and get a structured report back in seconds. Code & Documentation on GitHub.